

User Interface design
Calgary Transit Gap Analysis Mapping Transit Needs vs. Service User Interface design
UEFA Champions League 2021–2022 Player Analysis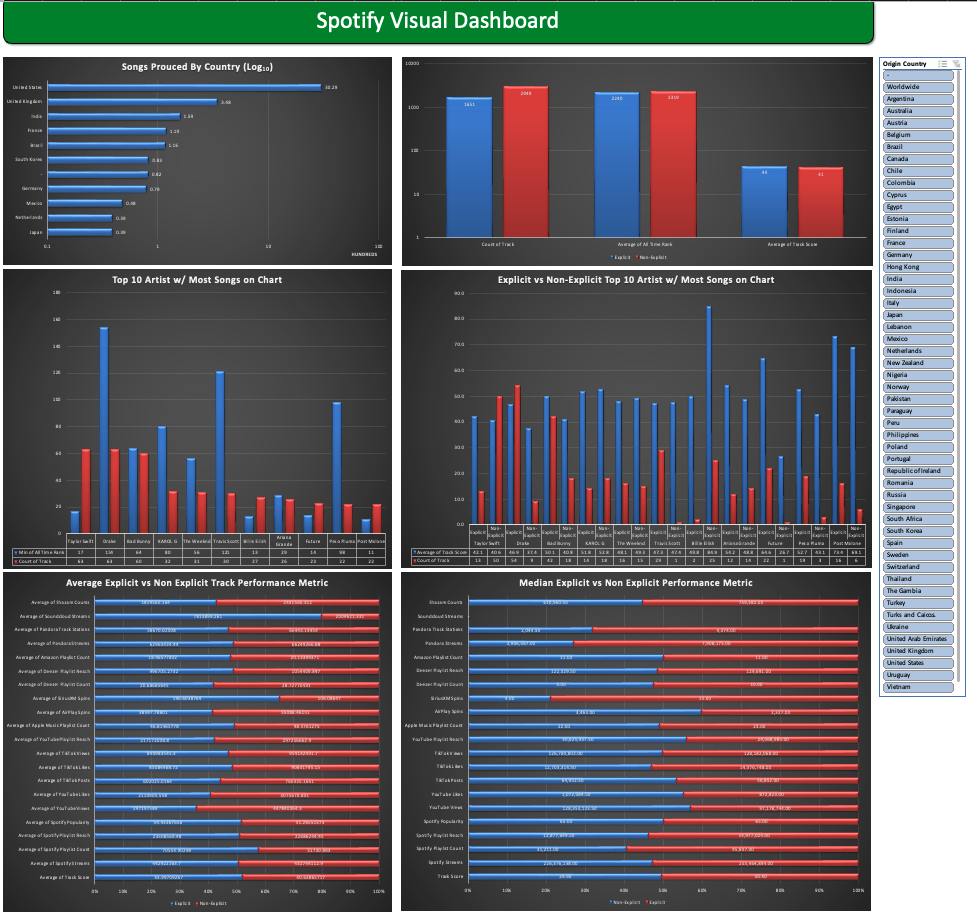
User Interface design
Spotify 2024 Song Chart Analysis